Pattern Matching and Alignment
In this notebook, we show how to do pattern matching and alignment using secbench primitives.
import importlib

import numpy as np
import matplotlib.pyplot as plt

# NOTE: tune the figure size as needed for better visualization in the notebook
plt.rcParams["figure.figsize"] = (14, 6)
from secbench.processing.helpers import qplot
from secbench.processing.signal import match_correlation, match_euclidean, phase_correlation
Input Generation
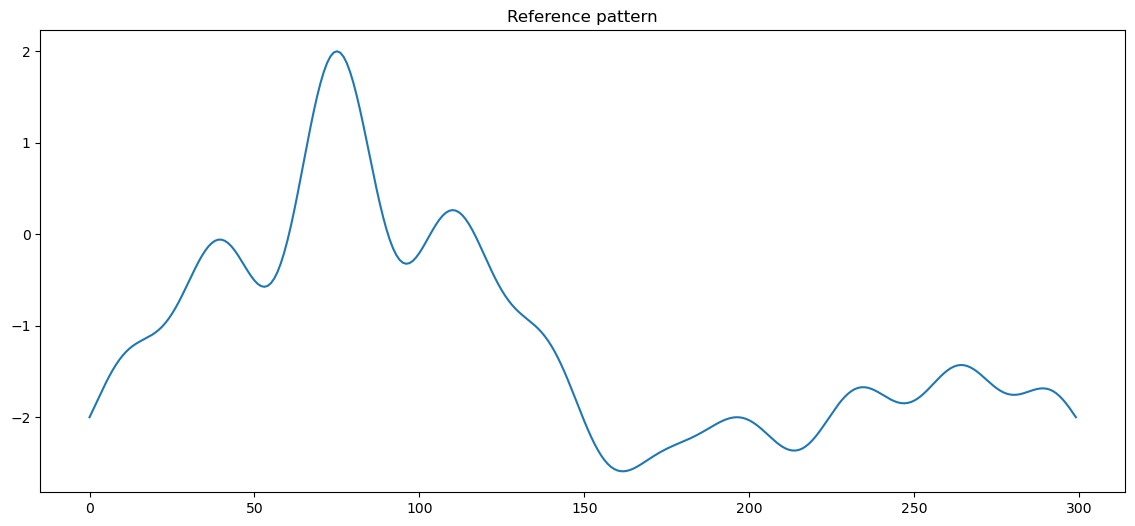
We start by generating a simple pattern:
pattern_width = 300

xs = np.linspace(-1, 3, pattern_width)
pattern = 2. * (np.sinc(xs**2) - np.sinc(xs - 4) + np.sinc(5 * xs) - 1)
pattern = pattern.astype(np.float32)
plt.plot(pattern)
plt.title("Reference pattern")
plt.show()
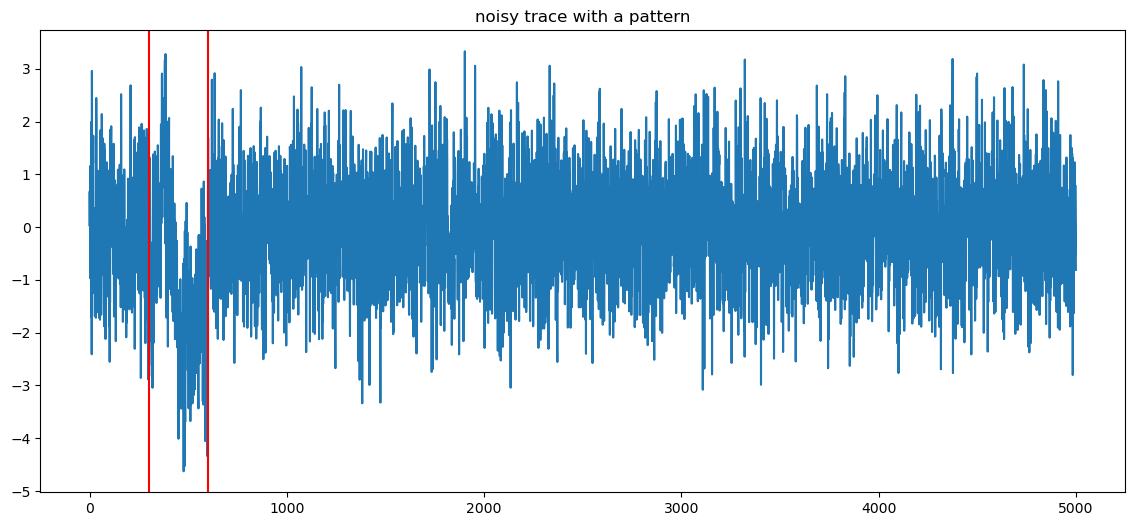
Then, we generate a trace and insert the pattern into it.
samples = 5000

offset = 300 # np.random.randint(pattern_width, samples - pattern_width)
p_start, p_end = offset, offset + pattern_width

data = np.random.normal(size=samples).astype(np.float32)
data[p_start:p_end] += pattern
print(f"offest is {offset}")

plt.plot(data)
plt.axvline(p_start, color="r")
plt.axvline(p_end, color="r")
plt.title("noisy trace with a pattern")
plt.show()
offest is 300
Pattern Matching
Now, we run the different matchers available:
secbench.processing.signal.match_correlation(), we are interested by the maximum value,secbench.processing.signal.match_euclidean(), we are interested by the minimum,secbench.processing.signal.phase_correlation(), we are interested by the maximum value.
matchers = [
    ("correlation", match_correlation, "max"),
    ("Eucliean distance", match_euclidean, "min"),
    ("Phase correlation", phase_correlation, "max")]

solutions = []
for label, matcher, order in matchers:
    fig, ax1 = plt.subplots()
    ax1.set_ylabel("metric")
    score = matcher(data, pattern, dtype=np.float32)
    sol = np.argmin(score) if order == "min" else np.argmax(score)
    solutions.append(sol)
    ax1.plot(score, color="red")
    ax1.axvline(sol, color="black", linestyle="--")

    ax2 = ax1.twinx()
    ax2.plot(data, alpha=0.3, color="green")
    ax2.set_ylabel("sample value")
    plt.title(f"Pattern matching with {label}")
    plt.show()

for (label, _, _), sol in zip(matchers, solutions):
    print(f"offset found by {label}: {sol}")
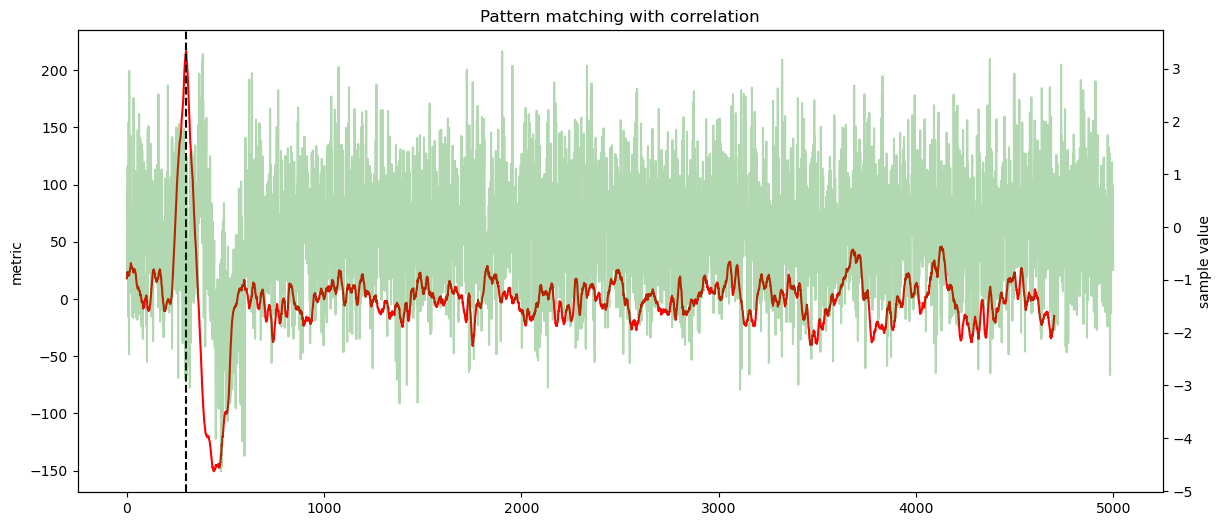
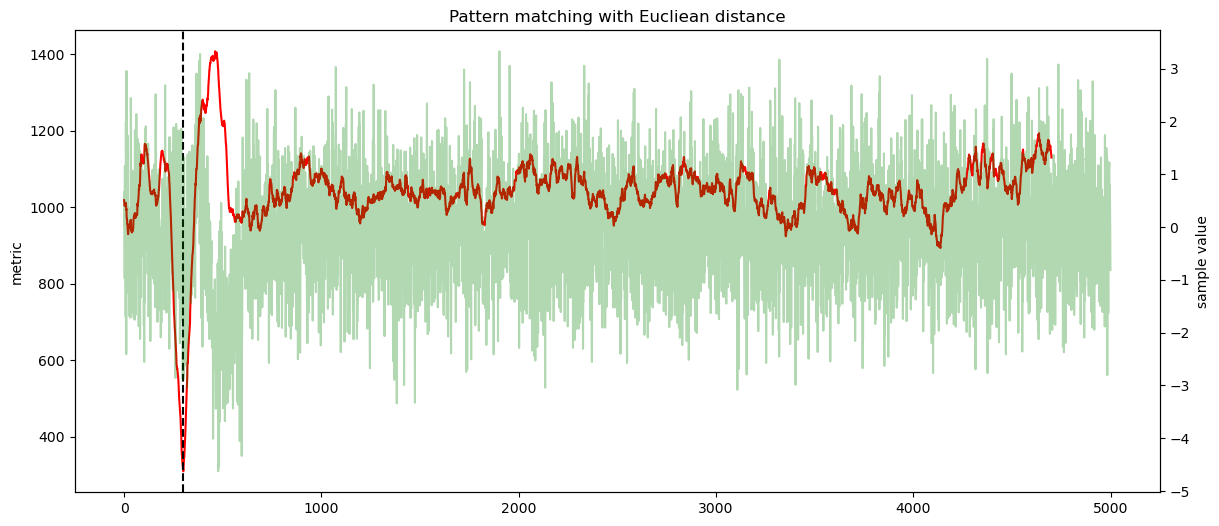
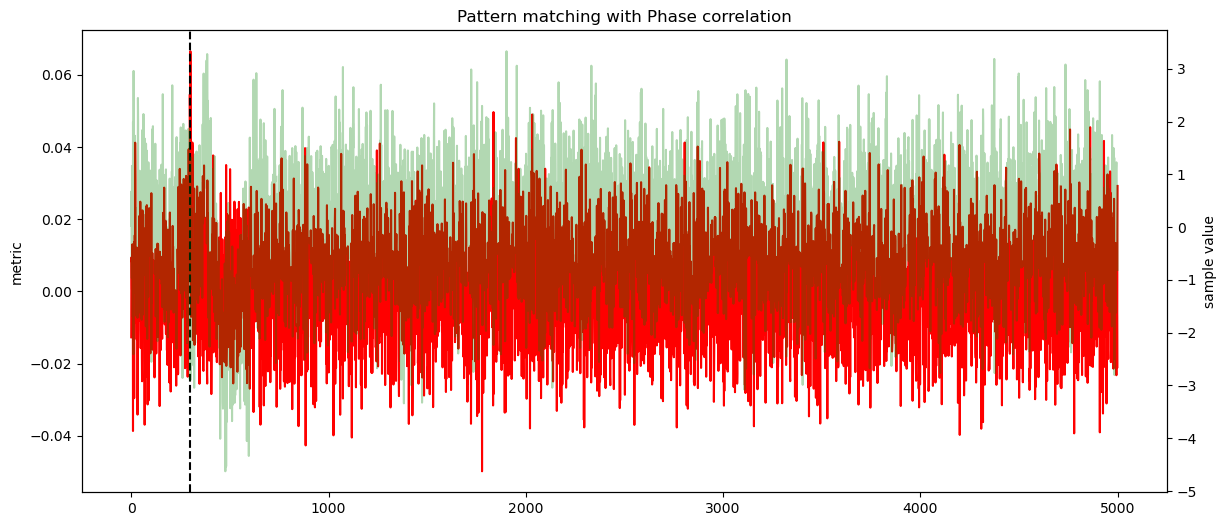
offset found by correlation: 300
offset found by Eucliean distance: 300
offset found by Phase correlation: 300
Alignment
Traces alignement simply consists of finding the pattern location in each trace and shifting them accordingly.
This section shows a basic example.
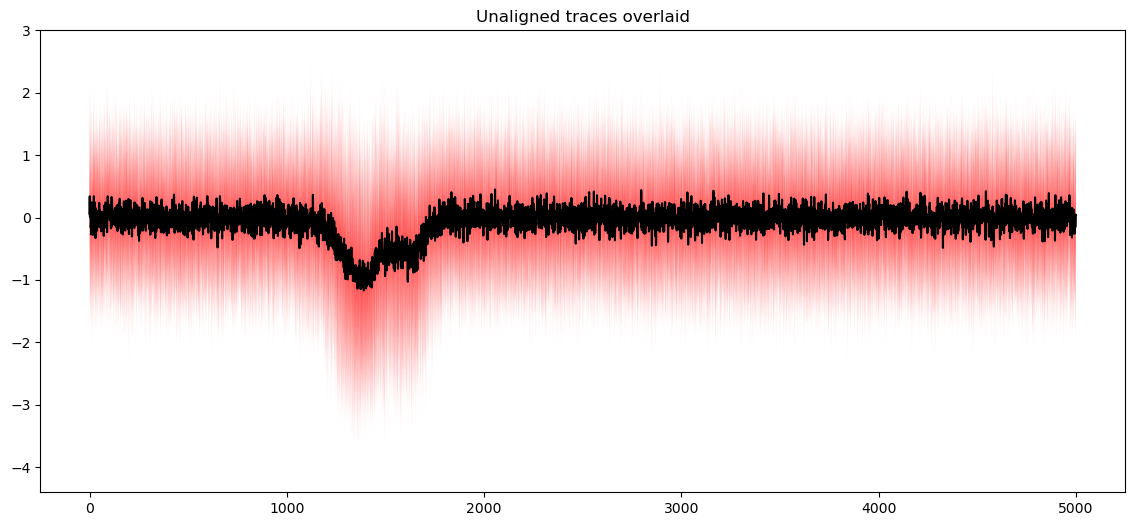
We first generate more traces using the same technique as in the previous section.
samples = 5000

data = np.zeros((50, samples), dtype=np.float32)

for i in range(data.shape[0]):
    offset = np.random.randint(1000, 1500)
    p_start, p_end = offset, offset + pattern_width
    data[i] = np.random.normal(size=samples).astype(np.float32)
    data[i, p_start:p_end] += pattern
qplot(data, plot_mean=True)
plt.title("Unaligned traces overlaid")
plt.show()
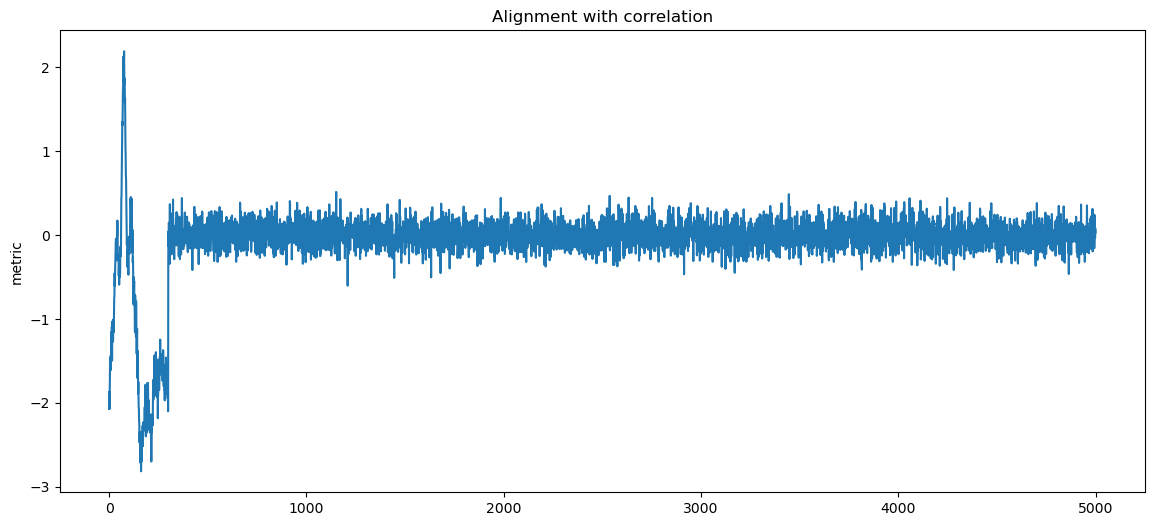
We now run the alignment.
matchers = [
("correlation", match_correlation, "max"),
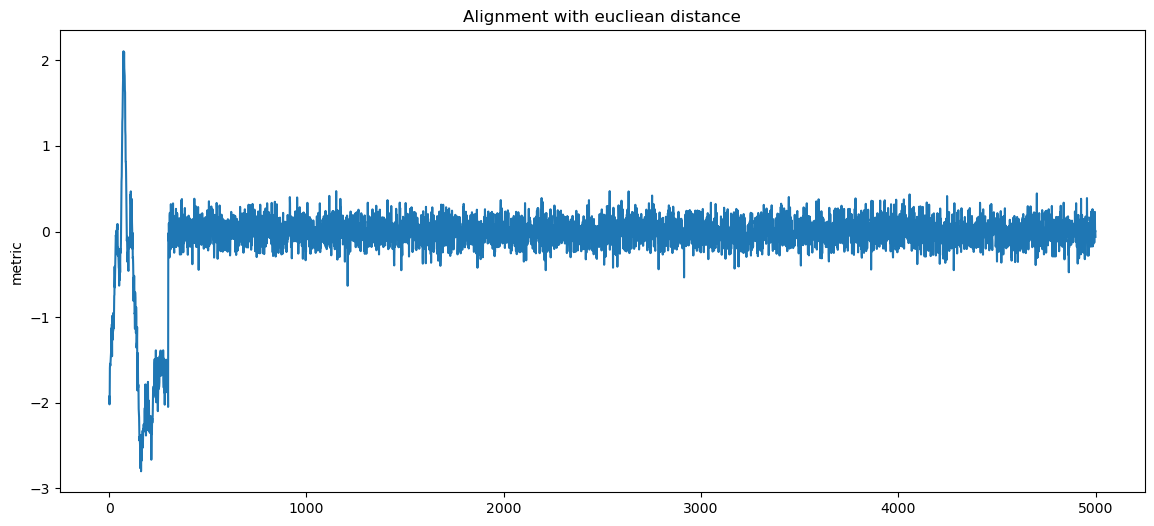
("eucliean distance", match_euclidean, "min"),
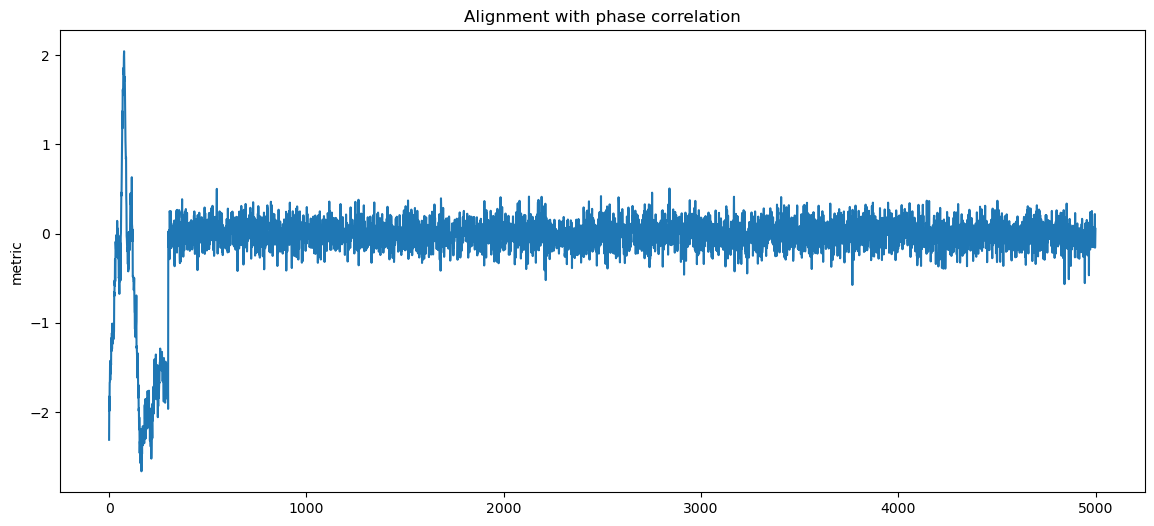
("phase correlation", phase_correlation, "max")]
for label, matcher, order in matchers:
fig, ax1 = plt.subplots()
ax1.set_ylabel("metric")
score = matcher(data, pattern)
sol = np.argmin(score, axis=1) if order == "min" else np.argmax(score, axis=1)
d_aligned = np.copy(data)
for i, sh in enumerate(sol):
d_aligned[i] = np.roll(d_aligned[i], -sh)
ax1.plot(np.mean(d_aligned, axis=0))
plt.title(f"Alignment with {label}")
plt.show()